Deforestation:
For my information visualization for Golan Levin’s Spring 2012 course Interactive Art and Computational Design, I wanted to visualize data in a way that engaged users with data that might be unpleasant. As most information visualizations are clean, crisp representations of facts, I created an interactive experience that forced users to do something bad or unpleasant in order to see data.
The dataset I chose was deforestation in the Amazon from 1987-2011. Originally, I wanted to have the unpleasant interaction be chopping down trees, but the chopping made too much of a game out of the data, which both trivialized the presentation and sort of made it “fun”. I wanted users to have sacrifice something they held dear to them in order to get more of the data.
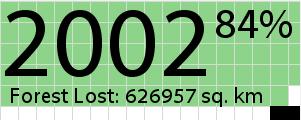
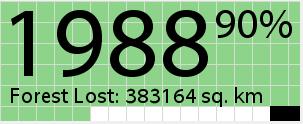
I settled on the idea of mapping area of the rainforest to area of your hard drive, with passive use of your computer “deforesting” more and more of your drive. There is something perverse about the gradual deletion of files, a kind of glee I felt as I zipped my mouse around the screen. Each of the 100 green squares above is 1% of your computer’s documents folder, which is deleted in real time. Each pixel your mouse moves ups the deforestation by 1 sq km, advancing the timeline faster the more you use your computer.
Process Work:
Initially the design had a color indicator as to your impact on your environment, in which the background transitions from green to gray as the forest disappeared. While the functionality of my first draft was reasonable, I was unhappy with the display. I changed the color scheme a bit, added in a different background info cue (with blocks of green background disappearing in correspondence to HD space). I cleaned up the typography, and changed the files deleted to square kilometers lost, to better engage users with the environmental aspect of the data. I also go rid of the hokey graphic of the tree. Another feature I added was that after you move beyond the first year of the visualization, the window locks in place and you’re stuck with program running. Thus, I arrived at the final design below:
Future Thoughts and Expansions:
Given time for expansion, I'd work to get a harder to kill/close version of this programmed (which would obviously need to be in something non-processing/non-java, as that’s about as safe as programs come), as well as making it autodetect the documents folder for Windows and Mac. I’d also like to see it generate some sort of summary, graphical report after it reaches the current year, perhaps something resembling Ben Schneiderman’s treemaps.